Longitudinal customer satisfaction
Lobster Ink (Ecolab), 2020
On product teams, we often like to see quantitative data to back up our qualitative findings (and vice-versa). How can we apply meaningful metrics to our UX explorations? This is a question I explored at Lobster Ink.
We had the use of a tool called Mixpanel to track events and measure time-on-task, conversion rate, and a few other quantitative measures in our key product areas. However, as we built out this functionality, how else could we identify areas of improvement? We could do this by measuring user satisfaction, also known as CSAT (customer satisfaction) scores.
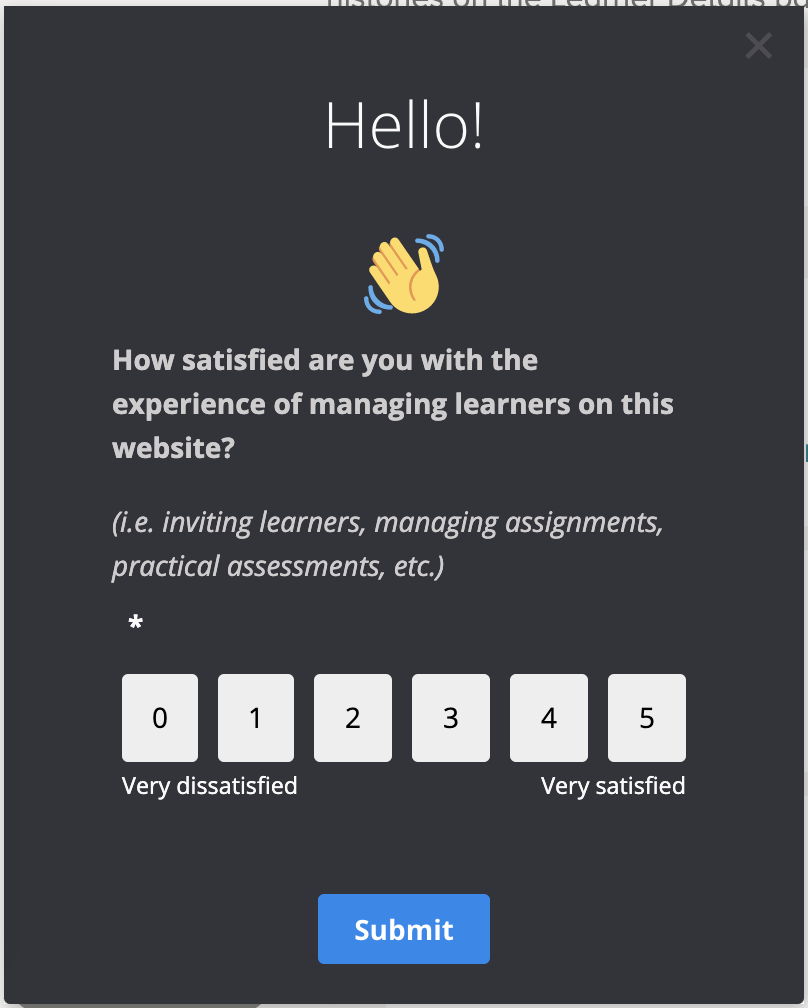
I identified keys areas in our users’ journey that both product and UX teams would like to measure and setup simple intercept surveys using Appcues to measure CSAT. The question was simply “How satisfied are you with X” and the respondant was provided with the opportunity to answer numerically on a scale from 1-5 & also provided the (optional) open-text field to explain their answer/offer any burning feedback.
The goal with measuring CSAT is to 1. create a baseline for how users experience products and 2. monitor this over time (have it reappear for users each quarter, for example) and take the opportunity to address issues in the experience when there are dips in the score and celebrate successes when there are rises!
Other measurement questions can be based on usefulness. For example, in our reporting experience, I altered the question to be “How useful is this report” - naming the report in question. This simple phrasing change speaks more to the utility of the product in question which is something that we were questioning on the product level.
Analysing these scores can be quite exciting as viewing them by client, language, region, even user segment can tell a story and demonstrate how different types of users can have varying feedback. Matching these with conversion rates and time-on-task can also tell a fuller story.
For a more qualitative-turned-quantitative approach, asking questions that offer insight into a user’s mindset can also offer great aha moments! For example, in trying to understand the validity of a feature idea, I asked our users in a survey how they would use said feature for the purpose of confirming/debunking our assumptions and to create a greater business case for the feature. With simple investigations like this, you can have an initial understanding if spending resources on something will be worthwhile.
This has a more generic focus for initial collection, but a drilled-down score can be collected at each key point in the user’s journey to isolate specific tasks.
Normally, I would do a 1-5 point scale, but due to the limitations of this tool and the reporting, it began at 0.